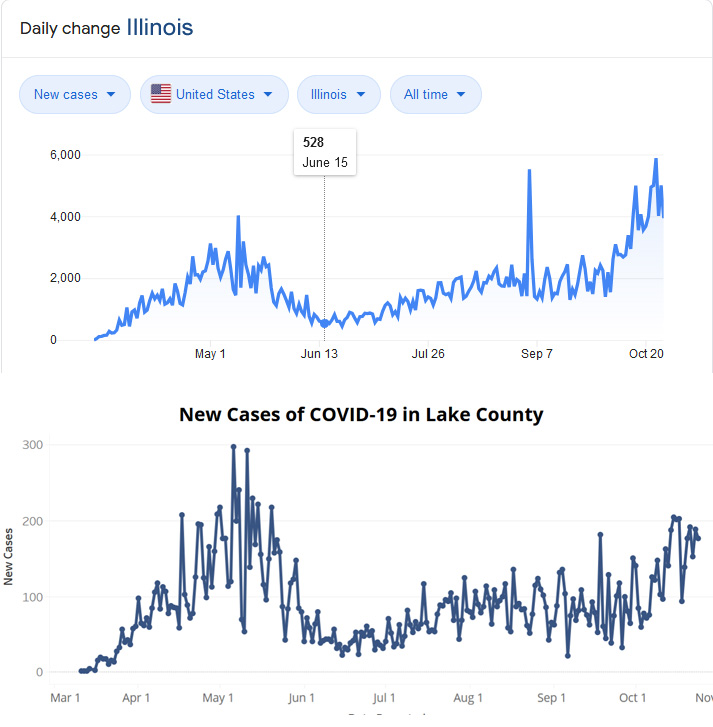
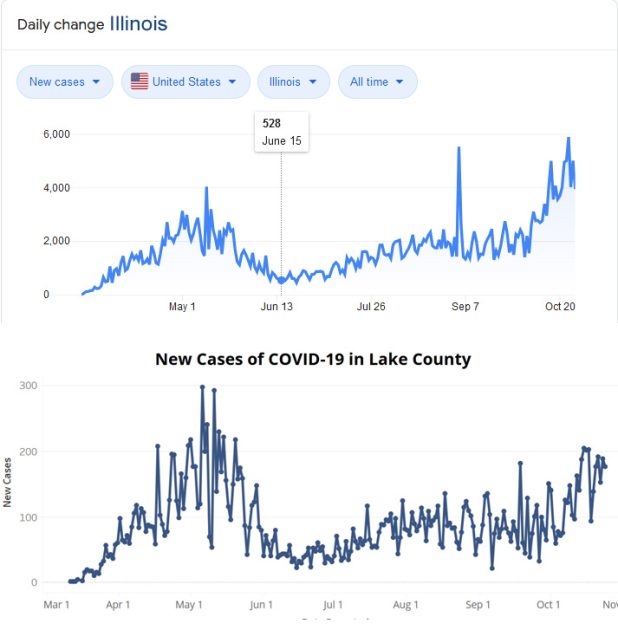
Graphs are VERY useful towards aiding the understanding of numerical data and trends. Been making and posting them since June. It is unfortunate that most covid-19 coverage in Illinois and by our own LCDPH rarely ever include state and local scale graphs. Scalars included in reporting just don’t help the audience in the same way. With that, here is a graph showing daily new cases in Illinois as a whole and in Lake County. People need to STOP throwing indoor parties and gatherings in their homes and STOP hanging out indoors at bars. These are two of the three main situations where spread occurs. We have been poised for a big break out since early August. Data never lies.